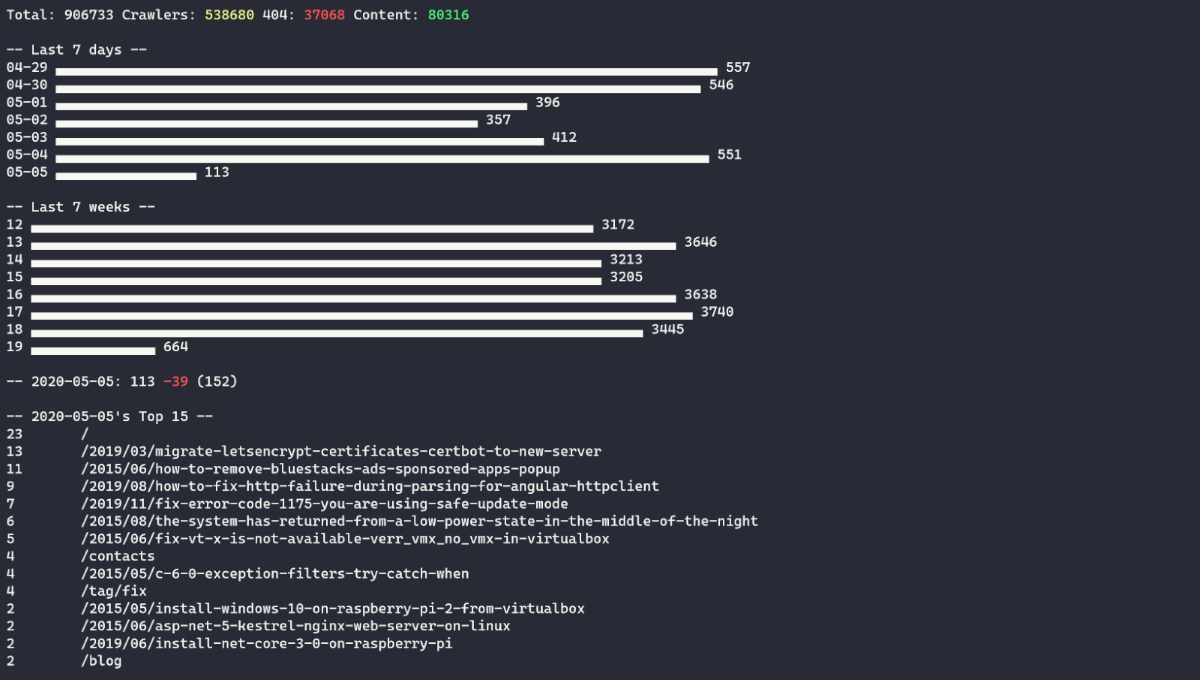
After I migrated my blog from a Wordpress CMS to a fully static website (powered by custom made site generator) I could not use Google Analytics anymore. When you do not have JavaScript running on the frontend, and no PHP processing requests from the users, there are not many options available to monitor how when your website is performing (in terms of visitors per day, per week, crawler's requests, etc). Since I use Nginx to serve static files, the only data I have to get some insights from is it's log files.
Alternatives
At first, I've tried GoAccess, a really powerful open-source web log analyzer and interactive viewer that runs in a terminal. It supports different log formats, can output data in an HTML page so you can view it in the browser, and can analyze logs in real-time.
Unfortunately, it didn't answer the questions I want to know about the performance of my website and had very limited filtering capabilities.
I wanted to see how many views do I receive week by week, what is the performance today in comparison with the previous day, see a detailed overview of the particular page (ULR). Limit output for the specific date.
On the filtering side, I wanted to exclude some URLs from the report(e.g. favicon, robots.txt, and some other).
There is a way to get some of the features by using awk (or any other tool) to prefilter log files before processing them with GoAccess. But it requires more time to manage when the amount of preprocessing grows.
Nginx Log Analytics
Then I decided to create a simple console application to analyze and visualize nginx log files in a way that gives me more control and a good overview of the performance of my website. Something I can run a few times per week and quickly see how well this website is performing.
The main idea was to get the result as soon as possible and with minimum effort. That is why this program has some limitations and the code is not something you want to show your kids.
But it does exactly what I need from it, and since it's quite a small program (around 1k loc), I can easily extend and modify it (event after a few months).
Requirements
Before writing this program I made a list of functional requirements:
- Get a top-level overview
- How many requests I got in total
- How many of them were made by crawlers, bots, spiders, etc.
- How many 404s
- How many real users view
- Overview of the last 7 days
- Only real users
- Overview of the last 7 weeks
- Only real users
- Real users views for today
- See the difference with the previous day
- Amount of view yesterday at the same time
- Todays Top 15 pages by real visitors
- Show all stats by a specific date
- Should act as if I run a program on the specified date
- Show detailed overview of the specific page (URL)
- Filter by date
- Show all requests to this page grouped by User-Agent
- Filter out content by URL
- Filter out content by User-Agent
After putting these requirements on paper I have started implementing them one by one.
Analytics
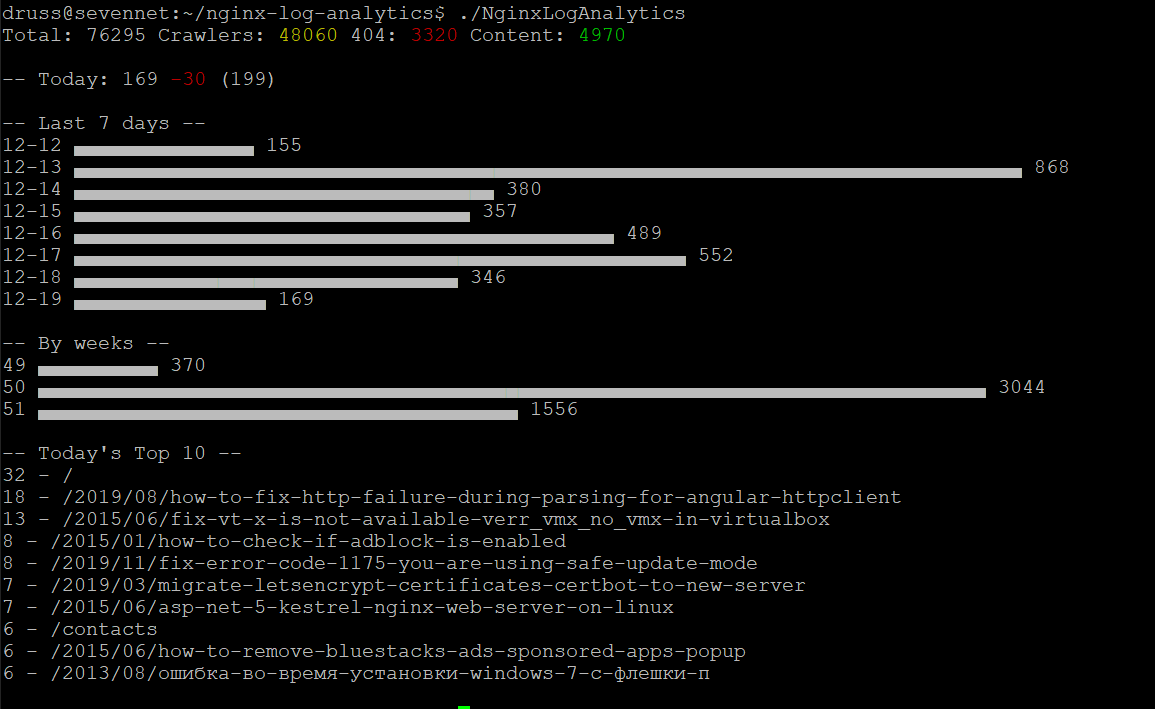
This is what you see after running the application without any arguments:
 This is enough to keep abreast of website'statistics. If I need to analyze some particular URL I can use
 --Url command-line argument.
Configuration
First, you need to add a custom log format to the nginx configuration.
Add
log_format custom '$time_local | $remote_addr | $request | $status | $body_bytes_sent | $http_referer | $http_user_agent | $request_time';to /etc/nginx/nginx.conf
Now you can use this format to log access messages:
access_log /var/ivanderevianko.com/logs/access.log custom;Now you need to configure Nginx Log Analytics, edit config.json and specify the correct location for your log files:
{
  "LogFilesFolderPath": "/var/ivanderevianko.com/logs/",
  "CrawlerUserAgentsFilePath": "ingore-user-agents.txt",
  "ExcludeContentFilePath": "exclude-from-content-list.txt"
}
You can also edit exclude-from-content-list.txt and ingore-user-agents.txt files to tailor filtering to your needs.
Why?
The first reason, it's fun! I like programming and writing this application was a very nice way to spend a few evenings.
The second reason, I want to keep track of the performance of my website and send at least possible time doing that. I have spent a bit of time developing this tool (comparable to the amount of time I would need to configure or modify existing tools) but I saved a lot of time using this tool (since it only gives me what I need and nothing more).
The third reason, play around with the latest version of the .NET core.
Source code and build instructions available on Github
You can as well download a self-contained binary for x64 Linux
